
To get analytics over your team, you can always in the "Team & Analytics" section. On the page, select the "Team Skills" tab.
❗It is only possible to build analytics after a review has been conducted❗
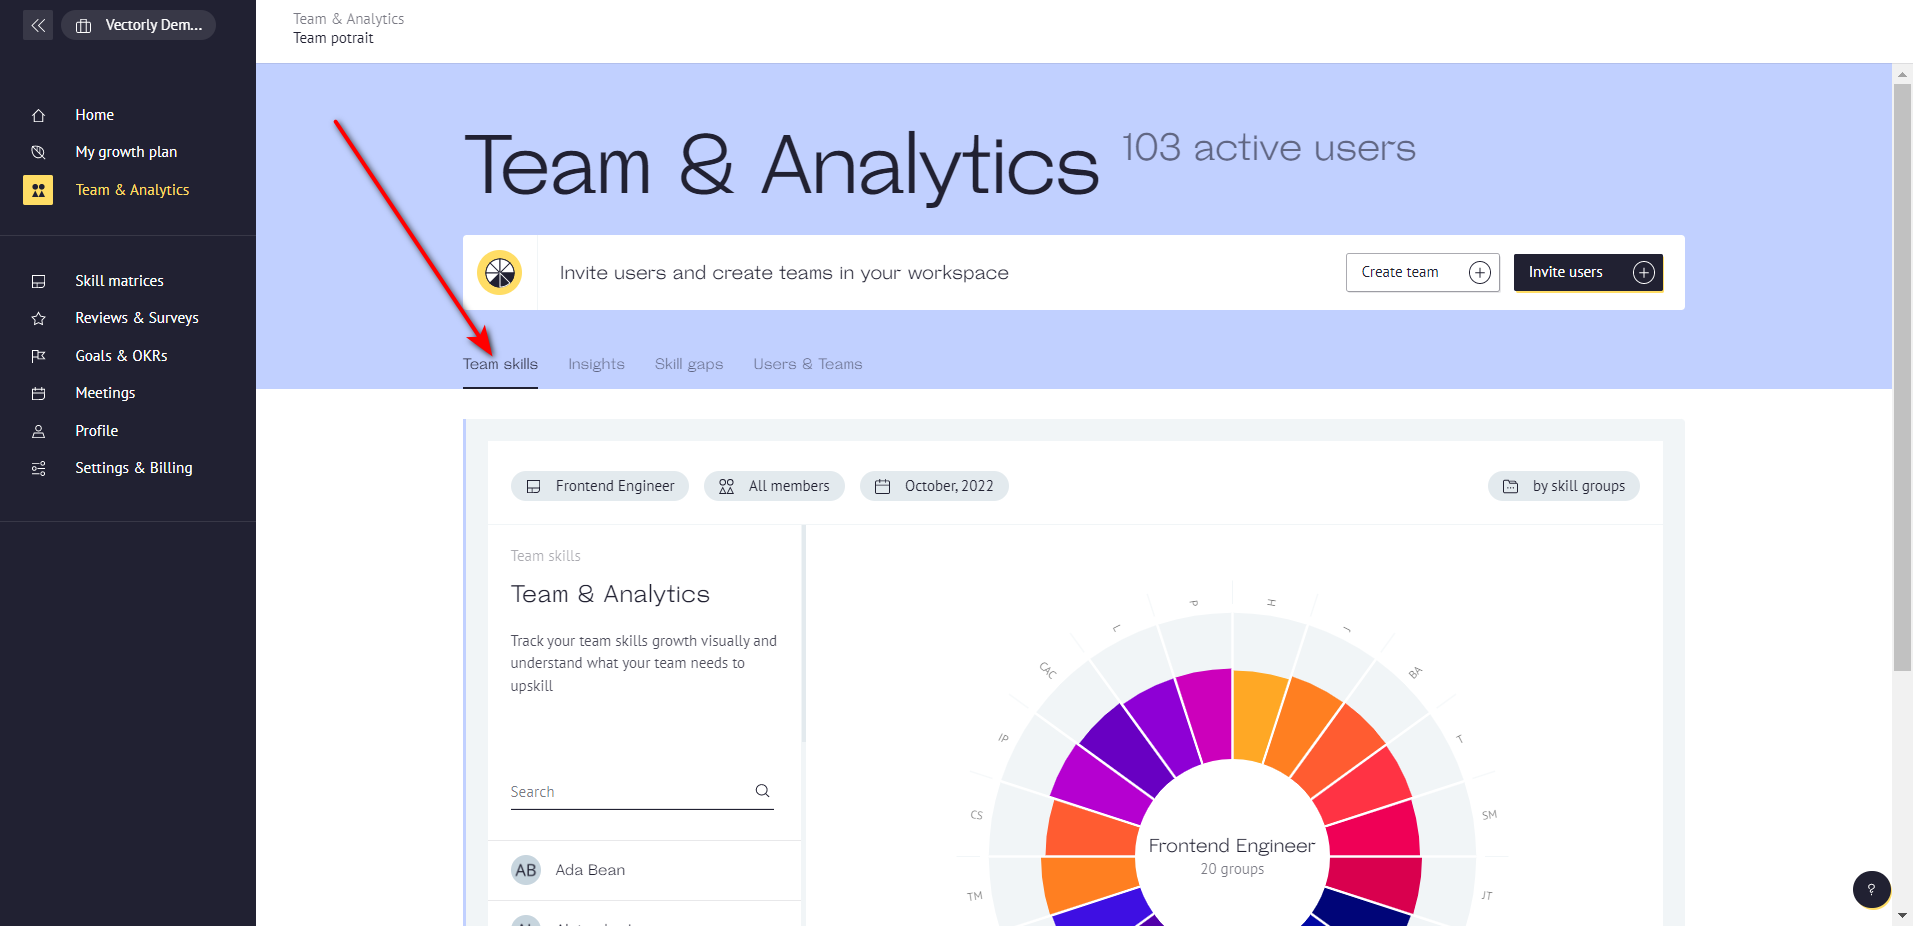
First, select the skill matrix for which you want to see analytics.
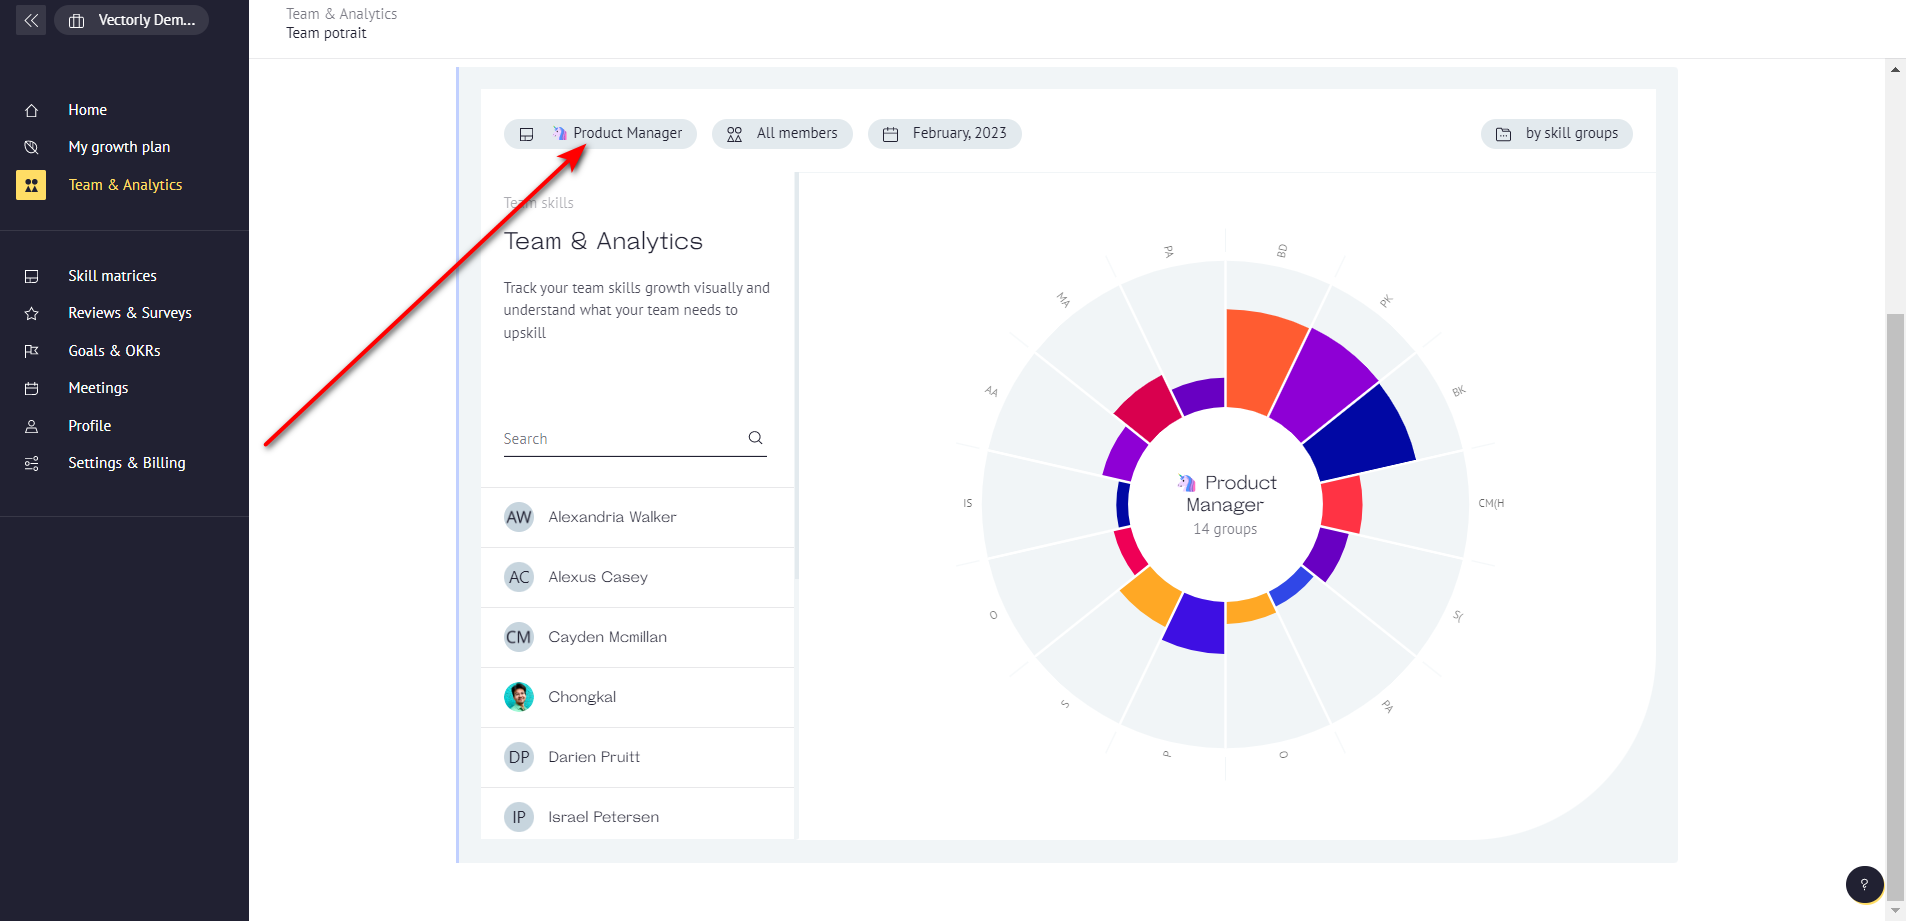
In the next two filters, you can filter the members of the skill matrix by team, role, or position; otherwise, we will show the progress of the entire skill matrix members.
And choose a period for filtration. By default, we are showing the current month & year.
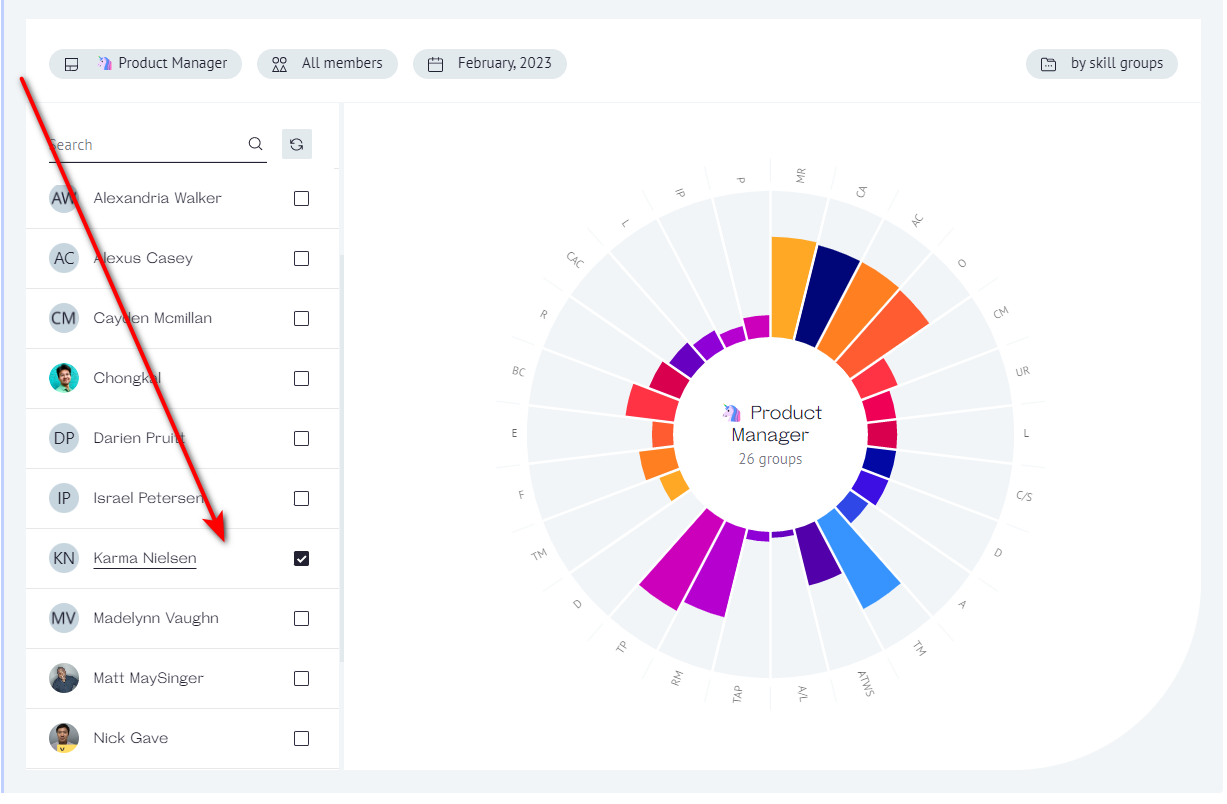
In the upper right corner of the chart, you can choose to display specific skill groups. Otherwise, we show all groups from the skill matrix.
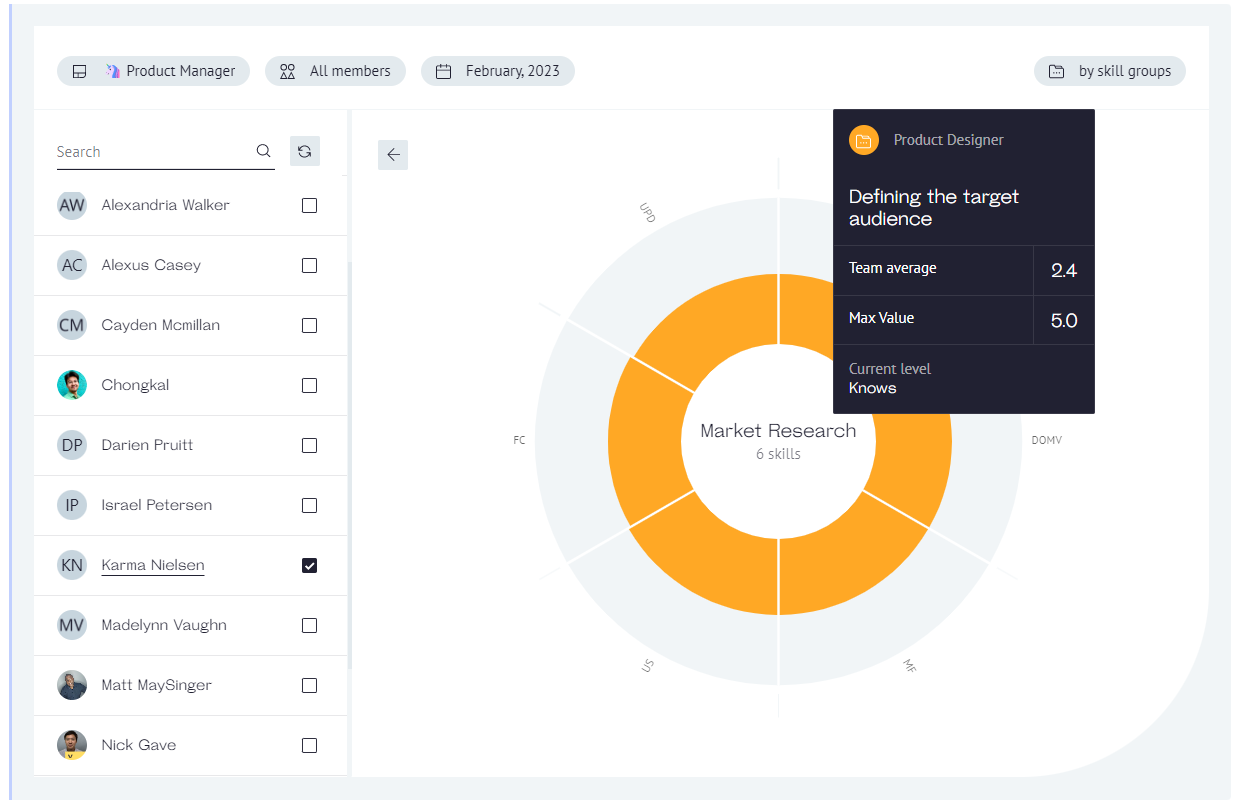
The participants whose data is used in the diagram are displayed to the left of the diagram. You can click the checkbox next to a participant's name in the list to see analytics only for that participant.
The principle of reading the diagram is quite simple: put the cursor on one of the colored elements to get more detailed information about the level.
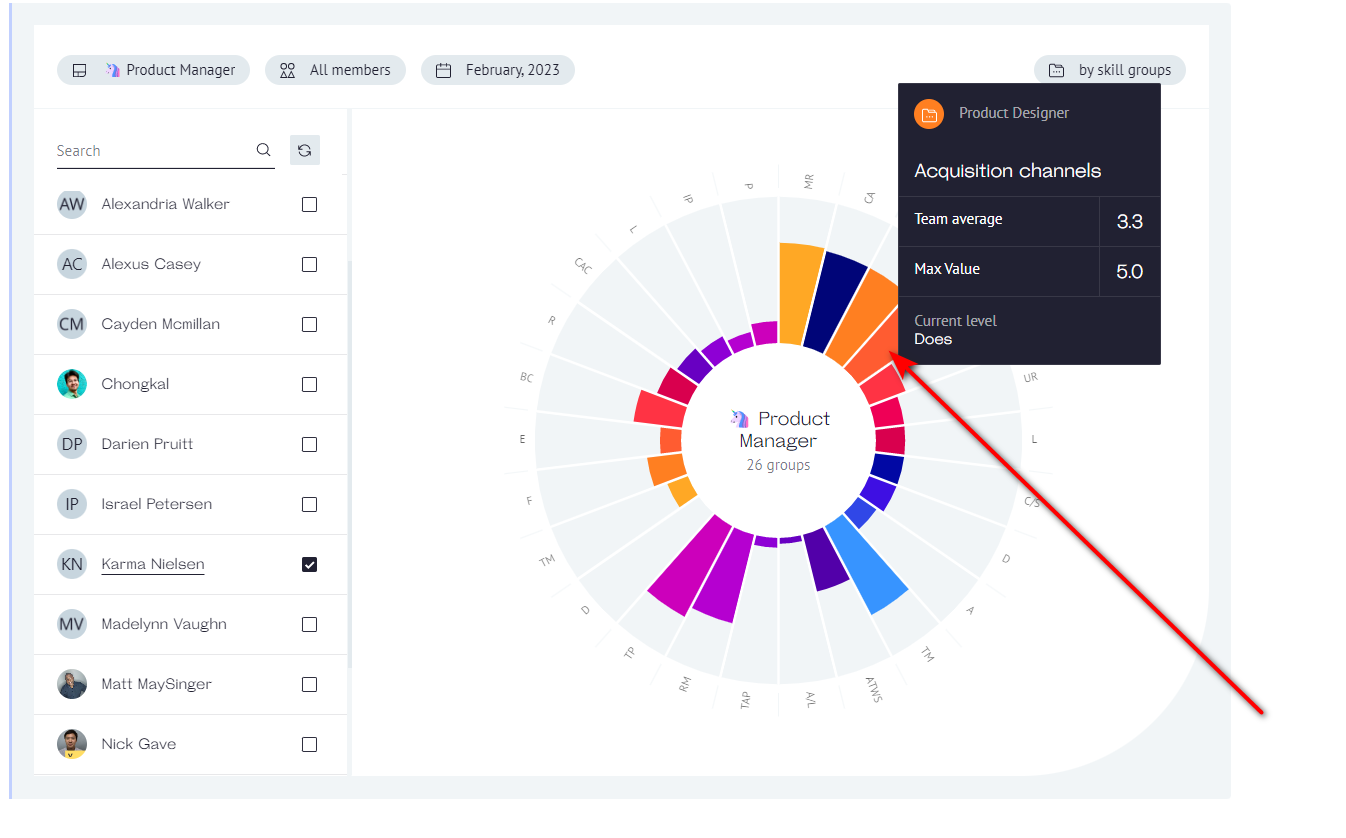
We will show the average skill's group level of the team. If one person is selected, then their average level. The Maximum possible skill level is the highest level set on the skill board. As well as the skill level in text format.
Clicking on the colored element on the diagram will bring you to the inside of the group. Here you can see the levels of specific skills from the skill group.
The average skill level of a group is made up of the average skill scores of that group.